

Last Updated on 14 June 2022
Behind the scenes at KRUZEY we work with big data and machine learning horse racing models.
We analysed 50,524 Australian thoroughbred horse races from 1/1/2018 to 30/4/2021.
Before we dive into the data, a big shout out to our friends at Betfair. If you are serious about horse racing data and analysis you need to get on board. The Betfair Hub is also an excellent resource if you are learning about profitable punting.
So, let’s get into it!
- 50,524 races.
- 1/1/18 – 30/4/21
- Thoroughbreds only.
- Betfair weighted average pre-race odds.
- Dead heats & equal favourites included. This is why some numbers are over 100%
- Cleansed data – outliers and races with incomplete data excluded.
All Races By Favourite Order
This table shows all races by favourite order. Number 1 is the favourite, number 2 is the second favourite and so on. Note that dead heats and equal favourites affect the total number of races.
The profit shown is the total of all monies returned on the winner less the total number of races – EG if you put a $1 (1 unit) bet on each available race, this would be your profit.
| Favourite Order | Total Races | Winners | Strike Rate | Return if Backed All | Profit |
|---|---|---|---|---|---|
| 1 | 50,624 | 16,930 | 33.44% | $48,272.86 | -$2,351.14 |
| 2 | 50,502 | 10,172 | 20.14% | $49,911.89 | -$590.11 |
| 3 | 50,524 | 6,960 | 13.78% | $49,941.55 | -$582.45 |
| 4 | 50,517 | 5,144 | 10.18% | $51,003.93 | $486.93 |
| 5 | 50,505 | 3,675 | 7.28% | $49,206.13 | -$1,298.87 |
| 6 | 50,500 | 2,865 | 5.67% | $52,713.77 | $2,213.77 |
| 7 | 50,524 | 1,923 | 3.81% | $48,376.18 | -$2,147.82 |
| 8 | 45,104 | 1,227 | 2.72% | $39,839.35 | -$5,264.65 |
| 9 | 37,782 | 762 | 2.02% | $33,258.51 | -$4,523.49 |
| 10 | 29,475 | 471 | 1.60% | $25,393.48 | -$4,081.52 |
| 11 | 20,494 | 261 | 1.27% | $19,227.58 | -$1,266.42 |
| 12 | 13,241 | 137 | 1.03% | $13,491.03 | $250.03 |
| 13 | 6,693 | 52 | 0.78% | $4,399.19 | -$2,293.81 |
| 14 | 3,703 | 25 | 0.68% | $3,308.50 | -$394.50 |
| 15 | 1,116 | 7 | 0.63% | $1,188.26 | $72.26 |
| 16 | 557 | 2 | 0.36% | $401.40 | -$155.60 |
| 17 | 69 | 1 | 1.45% | $45.33 | -$23.67 |
| 18 | 48 | 0.00% | $- | -$48.00 | |
| 19 | 18 | 0.00% | $- | -$18.00 | |
| 20 | 12 | 0.00% | $- | -$12.00 | |
| 21 | 4 | 0.00% | $- | -$4.00 | |
| 22 | 4 | 0.00% | $- | -$4.00 | |
| 23 | 3 | 0.00% | $- | -$3.00 | |
| 24 | 2 | 0.00% | $- | -$2.00 |
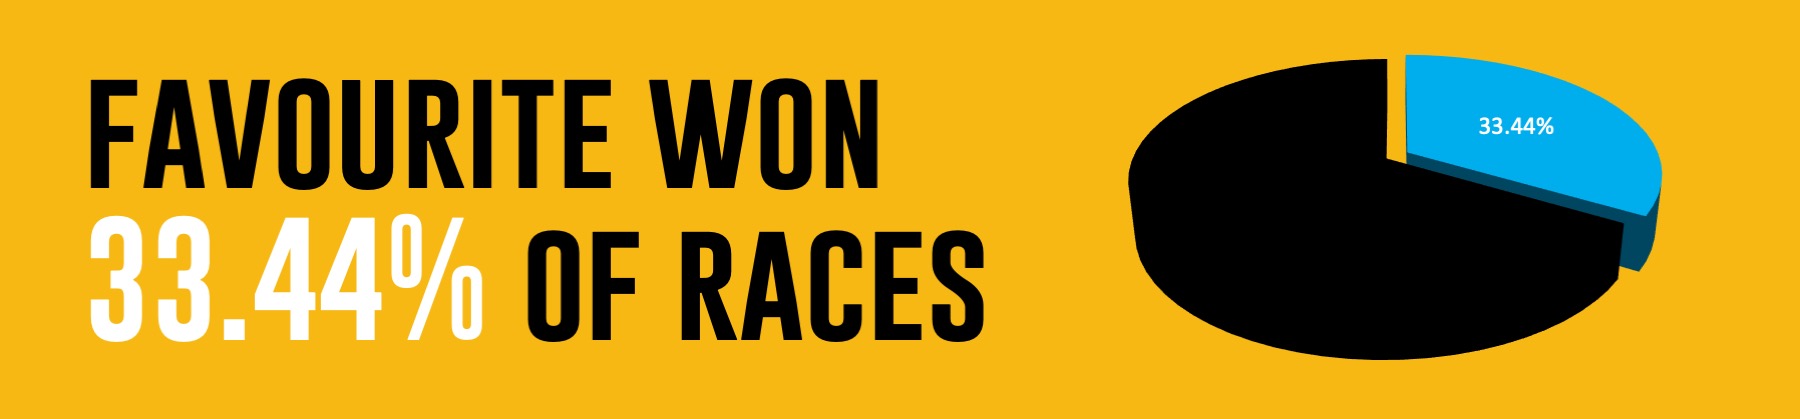
How often does the favourite horse win?
Over 50,624 races the favourite wins 33.44% of the time. If you backed every favourite for $1, you would have lost $2,351.14 over 50,624 $1 bets placed.
How often does the second favourite horse win?
Over 50,502 races the second favourite wins 20.14% of the time. If you backed every second favourite for $1, you would have lost $590.11 over 50,502 $1 bets placed.
How often does the third favourite horse win?
Over 50,524 races the third favourite wins 13.78% of the time. If you backed every third favourite for $1, you would have lost $582.45 over 50,524 $1 bets placed.
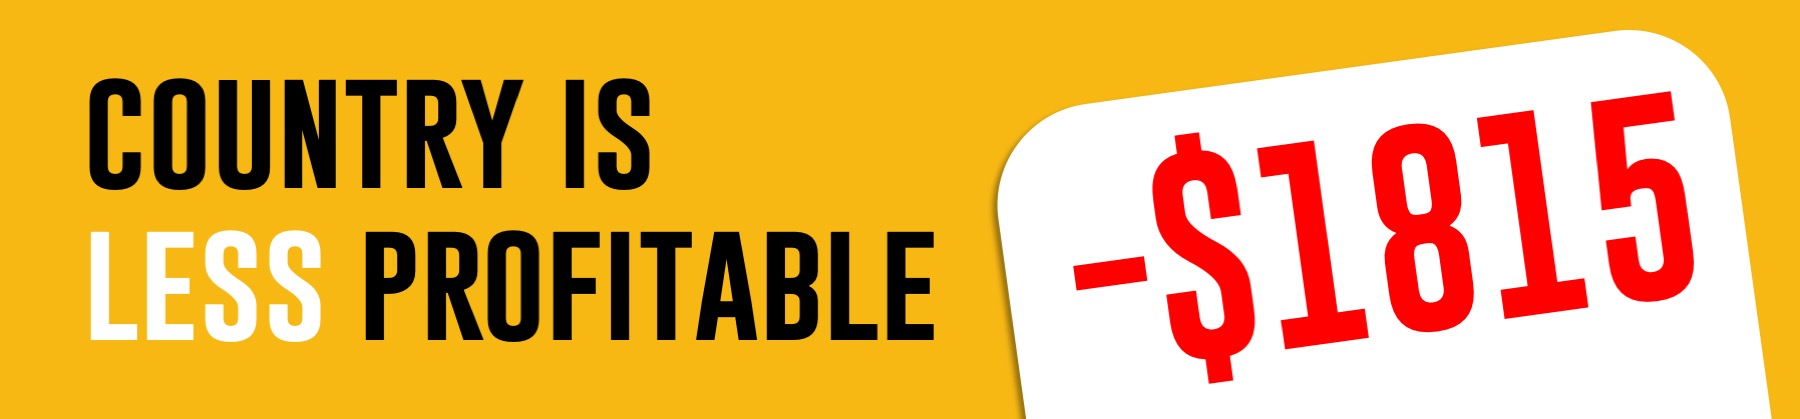
Country VS Metro Tracks For Favourite Winners.
This table shows how often the favourite wins between the county and metro tracks.
| Venue | Total Races | Winners | Strike Rate | Return if Backed All | Profit |
|---|---|---|---|---|---|
| Country | 39,156 | 13,219 | 33.76% | $37,340.99 | -$1,815.01 |
| Metro | 11,468 | 3,711 | 32.36% | $10,931.87 | -$536.13 |
Clearly, you cannot just back favourites based on country or metro. It is interesting to see that although the strike rate is similar, the variance in theoretical profit is quite large.
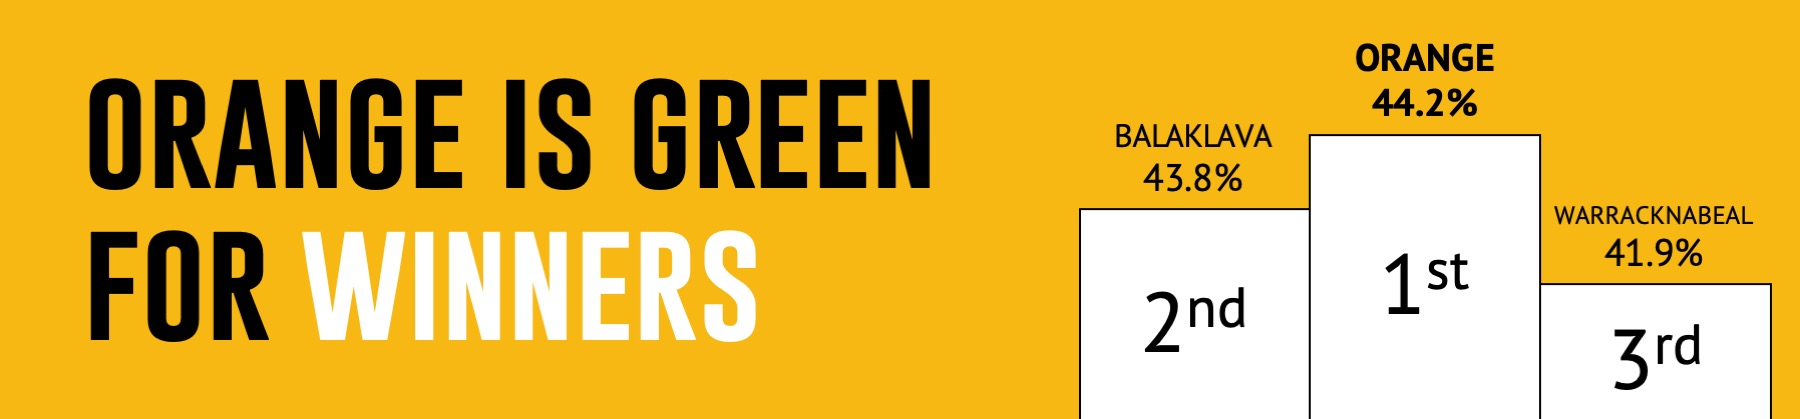
All Tracks For Favourite Winners.
This table shows how often the favourite wins by track.
| Track | Total Races | Winners | Strike Rate | Return if Backed All | Profit |
|---|---|---|---|---|---|
| Orange | 181 | 80 | 44.20% | $217.02 | $36.02 |
| Balaklava | 210 | 92 | 43.81% | $252.91 | $42.91 |
| Warracknabeal | 112 | 47 | 41.96% | $132.31 | $20.31 |
| Wyong | 489 | 193 | 39.47% | $485.05 | -$3.95 |
| Nowra | 249 | 98 | 39.36% | $279.97 | $30.97 |
| Mildura | 111 | 43 | 38.74% | $116.81 | $5.81 |
| Belmont Park | 900 | 348 | 38.67% | $927.84 | $27.84 |
| Murray Bridge | 435 | 168 | 38.62% | $463.11 | $28.11 |
| Kilmore | 216 | 83 | 38.43% | $232.89 | $16.89 |
| Gosford | 461 | 177 | 38.39% | $472.75 | $11.75 |
| Ipswich | 873 | 331 | 37.92% | $884.25 | $11.25 |
| Toowoomba | 935 | 350 | 37.43% | $943.35 | $8.35 |
| Albany | 399 | 149 | 37.34% | $445.89 | $46.89 |
| Sale | 469 | 175 | 37.31% | $500.53 | $31.53 |
| Werribee | 236 | 88 | 37.29% | $244.39 | $8.39 |
| Dalby | 197 | 73 | 37.06% | $215.71 | $18.71 |
| Hawkesbury | 490 | 180 | 36.73% | $494.05 | $4.05 |
| Goulburn | 417 | 153 | 36.69% | $422.42 | $5.42 |
| Wellington | 172 | 63 | 36.63% | $175.60 | $3.60 |
| Northam | 367 | 134 | 36.51% | $354.49 | -$12.51 |
| Ararat | 146 | 53 | 36.30% | $163.86 | $17.86 |
| Warwick Farm | 470 | 170 | 36.17% | $539.16 | $69.16 |
| Bathurst | 258 | 93 | 36.05% | $231.15 | -$26.85 |
| Sunshine Coast | 1461 | 526 | 36.00% | $1,435.32 | -$25.68 |
| Taree | 493 | 177 | 35.90% | $512.39 | $19.39 |
| Port Lincoln | 368 | 132 | 35.87% | $382.98 | $14.98 |
| Penola | 162 | 58 | 35.80% | $188.71 | $26.71 |
| Kempsey | 109 | 39 | 35.78% | $113.18 | $4.18 |
| Beaudesert | 260 | 93 | 35.77% | $252.96 | -$7.04 |
| Muswellbrook | 448 | 160 | 35.71% | $444.53 | -$3.47 |
| Cairns | 351 | 125 | 35.61% | $334.01 | -$16.99 |
| Gatton | 301 | 107 | 35.55% | $296.70 | -$4.30 |
| Mackay | 499 | 177 | 35.47% | $468.43 | -$30.57 |
| Newcastle | 841 | 298 | 35.43% | $788.33 | -$52.67 |
| Kyneton | 317 | 112 | 35.33% | $313.09 | -$3.91 |
| Ascot | 1441 | 509 | 35.32% | $1,427.98 | -$13.02 |
| Corowa | 136 | 48 | 35.29% | $135.22 | -$0.78 |
| Port Augusta | 173 | 61 | 35.26% | $173.94 | $0.94 |
| Devonport | 449 | 158 | 35.19% | $449.19 | $0.19 |
| Strathalbyn | 296 | 104 | 35.14% | $283.37 | -$12.63 |
| Scone | 488 | 171 | 35.04% | $478.96 | -$9.04 |
| Ballina | 290 | 101 | 34.83% | $294.13 | $4.13 |
| Grafton | 613 | 211 | 34.42% | $607.39 | -$5.61 |
| Esperance | 221 | 76 | 34.39% | $243.32 | $22.32 |
| Rockhampton | 762 | 262 | 34.38% | $710.55 | -$51.45 |
| Sapphire Coast | 224 | 77 | 34.38% | $216.16 | -$7.84 |
| Armidale | 201 | 69 | 34.33% | $202.47 | $1.47 |
| Port Macquarie | 446 | 153 | 34.30% | $454.70 | $8.70 |
| Bunbury | 555 | 190 | 34.23% | $504.25 | -$50.75 |
| Kalgoorlie | 433 | 148 | 34.18% | $421.13 | -$11.87 |
| Pakenham | 972 | 330 | 33.95% | $939.11 | -$32.89 |
| Canberra | 608 | 206 | 33.88% | $593.80 | -$14.20 |
| Doomben | 1120 | 379 | 33.84% | $1,070.66 | -$49.34 |
| Dubbo | 398 | 134 | 33.67% | $392.45 | -$5.55 |
| Darwin | 488 | 164 | 33.61% | $495.82 | $7.82 |
| Cranbourne | 581 | 193 | 33.22% | $574.89 | -$6.11 |
| Bendigo | 588 | 195 | 33.16% | $589.22 | $1.22 |
| Murwillumbah | 166 | 55 | 33.13% | $149.29 | -$16.71 |
| Albury | 360 | 119 | 33.06% | $335.25 | -$24.75 |
| Coffs Harbour | 310 | 102 | 32.90% | $302.10 | -$7.90 |
| Stony Creek | 134 | 44 | 32.84% | $133.11 | -$0.89 |
| York | 132 | 43 | 32.58% | $134.00 | $2.00 |
| Gold Coast | 1210 | 394 | 32.56% | $1,129.37 | -$80.63 |
| Moruya | 258 | 84 | 32.56% | $265.72 | $7.72 |
| Launceston | 639 | 208 | 32.55% | $558.21 | -$80.79 |
| Morphettville | 1159 | 377 | 32.53% | $1,099.80 | -$59.20 |
| Lismore | 225 | 73 | 32.44% | $210.95 | -$14.05 |
| Mornington | 427 | 138 | 32.32% | $416.31 | -$10.69 |
| Narrogin | 121 | 39 | 32.23% | $95.72 | -$25.28 |
| Wodonga | 202 | 65 | 32.18% | $187.30 | -$14.70 |
| Geelong | 703 | 225 | 32.01% | $634.13 | -$68.87 |
| Broome | 100 | 32 | 32.00% | $83.20 | -$16.80 |
| Kembla Grange | 663 | 212 | 31.98% | $591.85 | -$71.15 |
| Bordertown | 113 | 36 | 31.86% | $100.50 | -$12.50 |
| Geraldton | 487 | 155 | 31.83% | $435.99 | -$51.01 |
| Moonee Valley | 595 | 189 | 31.76% | $584.41 | -$10.59 |
| Pinjarra | 666 | 211 | 31.68% | $569.85 | -$96.15 |
| Townsville | 679 | 215 | 31.66% | $614.87 | -$64.13 |
| Swan Hill | 263 | 83 | 31.56% | $240.43 | -$22.57 |
| Moe | 381 | 120 | 31.50% | $363.34 | -$17.66 |
| Wagga | 597 | 188 | 31.49% | $544.62 | -$52.38 |
| Hobart | 290 | 91 | 31.38% | $249.60 | -$40.40 |
| Tamworth | 428 | 134 | 31.31% | $379.72 | -$48.28 |
| Alice Springs | 439 | 137 | 31.21% | $408.31 | -$30.69 |
| Caulfield | 668 | 208 | 31.14% | $661.47 | -$6.53 |
| Yarra Valley | 219 | 68 | 31.05% | $203.15 | -$15.85 |
| Gawler | 520 | 161 | 30.96% | $435.54 | -$84.46 |
| Ballarat | 734 | 226 | 30.79% | $643.48 | -$90.52 |
| Mudgee | 151 | 46 | 30.46% | $122.15 | -$28.85 |
| Eagle Farm | 539 | 164 | 30.43% | $477.16 | -$61.84 |
| Mount Barker | 102 | 31 | 30.39% | $95.30 | -$6.70 |
| Narromine | 126 | 38 | 30.16% | $112.84 | -$13.16 |
| Seymour | 166 | 50 | 30.12% | $146.02 | -$19.98 |
| Randwick | 1107 | 332 | 29.99% | $1,012.48 | -$94.52 |
| Benalla | 280 | 83 | 29.64% | $234.11 | -$45.89 |
| Tatura | 108 | 32 | 29.63% | $95.52 | -$12.48 |
| Kilcoy | 183 | 54 | 29.51% | $145.77 | -$37.23 |
| Sandown | 782 | 230 | 29.41% | $728.42 | -$53.58 |
| Wangaratta | 335 | 98 | 29.25% | $275.83 | -$59.17 |
| Warrnambool | 407 | 119 | 29.24% | $338.39 | -$68.61 |
| Warwick | 130 | 38 | 29.23% | $105.80 | -$24.20 |
| Flemington | 688 | 201 | 29.22% | $639.25 | -$48.75 |
| Naracoorte | 191 | 55 | 28.80% | $173.21 | -$17.79 |
| Bairnsdale | 139 | 40 | 28.78% | $109.77 | -$29.23 |
| Canterbury Park | 463 | 133 | 28.73% | $398.40 | -$64.60 |
| Echuca | 387 | 111 | 28.68% | $335.07 | -$51.93 |
| Queanbeyan | 227 | 65 | 28.63% | $166.43 | -$60.57 |
| Carnarvon | 175 | 50 | 28.57% | $137.46 | -$37.54 |
| Rosehill | 607 | 172 | 28.34% | $557.03 | -$49.97 |
| Moree | 138 | 39 | 28.26% | $110.45 | -$27.55 |
| Hamilton | 179 | 50 | 27.93% | $144.30 | -$34.70 |
| Gundagai | 133 | 37 | 27.82% | $105.29 | -$27.71 |
| Terang | 174 | 48 | 27.59% | $142.53 | -$31.47 |
| Quirindi | 120 | 33 | 27.50% | $87.93 | -$32.07 |
| Gunnedah | 176 | 48 | 27.27% | $139.94 | -$36.06 |
| Stawell | 145 | 39 | 26.90% | $114.38 | -$30.62 |
| Donald | 196 | 50 | 25.51% | $143.58 | -$52.42 |
Who knows why! For some reason, the punters seem to know when a winner is primed at Orange.
Classes For Favourite Winners.
This table shows how often the favourite wins, broken down by the class of the race.
| Class | Total Races | Winners | Strike Rate | Return if Backed All | Profit |
|---|---|---|---|---|---|
| HCAP | 21,491 | 6,414 | 29.85% | $19,843.94 | -$1,647.06 |
| MDN | 12,199 | 4,661 | 38.21% | $12,089.34 | -$109.66 |
| CL1 | 4,146 | 1,451 | 35.00% | $3,982.62 | -$163.38 |
| 3YO | 3,638 | 1,312 | 36.06% | $3,564.81 | -$73.19 |
| CL2 | 2,296 | 787 | 34.28% | $2,219.20 | -$76.80 |
| 2YO | 1,717 | 614 | 35.76% | $1,657.87 | -$59.13 |
| CL3 | 1,637 | 543 | 33.17% | $1,555.51 | -$81.49 |
| LISTED | 818 | 264 | 32.27% | $765.17 | -$52.83 |
| GRP3 | 527 | 157 | 29.79% | $470.80 | -$56.20 |
| CL5 | 497 | 193 | 38.83% | $566.81 | $69.81 |
| CUP | 349 | 102 | 29.23% | $315.03 | -$33.97 |
| CL6 | 303 | 105 | 34.65% | $289.42 | -$13.58 |
| CL4 | 299 | 116 | 38.80% | $321.85 | $22.85 |
| GRP2 | 283 | 91 | 32.16% | $274.48 | -$8.52 |
| GRP1 | 234 | 67 | 28.63% | $199.96 | -$34.04 |
| QLTY | 143 | 34 | 23.78% | $104.92 | -$38.08 |
We have heard more than once that we should avoid Maidens. The data suggest that it is one of the best places to look for a favourite winner.

Distance For Favourite Winners.
This table shows how often the favourite wins over the distance. Note the tracks were grouped to their nearest 100 meters. EG If the race was 1820m, it would be grouped together as an 1800m.
| Distance | Total Races | Winners | Strike Rate | Return if Backed All | Profit |
|---|---|---|---|---|---|
| 800 | 205 | 68 | 33.17% | $170.32 | -$34.68 |
| 900 | 796 | 306 | 38.44% | $792.37 | -$3.63 |
| 1000 | 5,716 | 1,999 | 34.97% | $5,527.89 | -$188.11 |
| 1100 | 6,088 | 2,118 | 34.79% | $5,879.12 | -$208.88 |
| 1200 | 10,139 | 3,451 | 34.04% | $9,735.73 | -$403.27 |
| 1300 | 4,209 | 1,402 | 33.31% | $4,050.19 | -$158.81 |
| 1400 | 8,431 | 2,769 | 32.84% | $8,058.64 | -$372.36 |
| 1500 | 1,866 | 578 | 30.98% | $1,675.82 | -$190.18 |
| 1600 | 5,930 | 1,919 | 32.36% | $5,558.92 | -$371.08 |
| 1700 | 1,057 | 334 | 31.60% | $934.75 | -$122.25 |
| 1800 | 1,221 | 375 | 30.71% | $1,124.08 | -$96.92 |
| 1900 | 772 | 267 | 34.59% | $788.67 | $16.67 |
| 2000 | 1,650 | 547 | 33.15% | $1,632.70 | -$17.30 |
| 2100 | 806 | 268 | 33.25% | $774.64 | -$31.36 |
| 2200 | 827 | 250 | 30.23% | $728.07 | -$98.93 |
| 2300 | 77 | 19 | 24.68% | $53.67 | -$23.33 |
| 2400 | 509 | 157 | 30.84% | $474.97 | -$34.03 |
| 2500 | 143 | 48 | 33.57% | $148.10 | $5.10 |
| 2600 | 60 | 19 | 31.67% | $51.97 | -$8.03 |
| 2700 | 12 | 3 | 25.00% | $6.55 | -$5.45 |
| 2800 | 24 | 6 | 25.00% | $19.67 | -$4.33 |
| 3000 | 22 | 6 | 27.27% | $19.69 | -$2.31 |
| 3100 | 10 | 2 | 20.00% | $6.34 | -$3.66 |
| 3200 | 30 | 7 | 23.33% | $23.55 | -$6.45 |
Could it be the shorter the distance the less opportunity for something to go wrong in the race? Regardless, it is an interesting piece of data that creates more questions than answers.

Bit Of Fun – First Letter Of The Horses Name For Any Winner.
We looked at the first letter in every horse’s name and winners across all races (not just favourites) It doesn’t really mean much but it is interesting nonetheless.
| First Letter Of Horses Name | Total Races | Winners | Strike Rate | Return if Backed All | Profit |
|---|---|---|---|---|---|
| A | 30,232 | 3,010 | 9.96% | $29,615.80 | ($616.20) |
| B | 34,043 | 3,366 | 9.89% | $33,331.04 | ($711.96) |
| C | 35,694 | 3,467 | 9.71% | $34,049.99 | ($1,644.01) |
| D | 26,692 | 2,512 | 9.41% | $25,381.30 | ($1,310.70) |
| E | 15,465 | 1,658 | 10.72% | $15,563.23 | $98.23 |
| F | 19,827 | 2,029 | 10.23% | $19,666.57 | ($160.43) |
| G | 19,230 | 1,894 | 9.85% | $18,014.12 | ($1,215.88) |
| H | 19,359 | 1,933 | 9.99% | $18,837.45 | ($521.55) |
| I | 12,848 | 1,343 | 10.45% | $13,496.35 | $648.35 |
| J | 9,531 | 882 | 9.25% | $8,275.84 | ($1,255.16) |
| K | 12,390 | 1,167 | 9.42% | $10,972.73 | ($1,417.27) |
| L | 24,134 | 2,394 | 9.92% | $23,630.98 | ($503.02) |
| M | 42,877 | 4,319 | 10.07% | $42,366.37 | ($510.63) |
| N | 12,051 | 1,213 | 10.07% | $12,833.21 | $782.21 |
| O | 12,800 | 1,244 | 9.72% | $11,641.59 | ($1,158.41) |
| P | 24,478 | 2,432 | 9.94% | $22,875.11 | ($1,602.89) |
| Q | 2,386 | 225 | 9.43% | $2,034.41 | ($351.59) |
| R | 27,689 | 2,674 | 9.66% | $26,249.99 | ($1,439.01) |
| S | 61,433 | 5,962 | 9.70% | $56,141.40 | ($5,291.60) |
| T | 33,637 | 3,416 | 10.16% | $31,651.55 | ($1,985.45) |
| U | 4,244 | 403 | 9.50% | $4,413.49 | $169.49 |
| V | 8,065 | 776 | 9.62% | $6,804.96 | ($1,260.04) |
| W | 14,321 | 1,468 | 10.25% | $13,860.86 | ($460.14) |
| X | 239 | 24 | 10.04% | $184.68 | ($54.32) |
| Y | 3,181 | 281 | 8.83% | $2,561.01 | ($619.99) |
| Z | 5,175 | 522 | 10.09% | $5,524.91 | $349.91 |
In Conclusion
If you see a Favourite running at Orange in a Maiden over a short distance and its name starts with an “N” – just back it 😉
Even if you used the best betting site in the world, you would be hard-pressed to make a profit by blindly backing on arbitrary metrics. You should always be looking for the best odds and promos that help put the, ahem, odds in your favour.