
Melbourne Cup Betting Sites
The Verdict Is In (and It’s Not Sportsbet) – Best…

It’s been a while since we last reviewed the numbers on favourites winning, and much has changed.
We’re excited to share our latest insights for 2024, updating a piece first written on September 12, 2021.
In this analysis, we’ve examined 46,403 Australian thoroughbred races from February 1, 2022, to October 13, 2024, giving a fresh look at how often favourites come out on top and how their performance affects profitability.
Before we dive into the findings, a big shoutout to our friends at Rapro. If you’re serious about data-driven betting, Rapro offers some of the best resources for maximising your edge in horse racing.
So, Let’s Dig Into The Numbers!

This table shows all records by favourite order. Number 1 is the favourite, number 2 is the second favourite, and so on. Note that dead heats and equal favourites affect the total number of races.
The profit shown is the total of all monies returned on the winner less the total number of races – e.g., if you put a $1 (1 unit) bet on each available race, this would be your profit.
Over 47,660 races, the favourite wins 34.9% of the time. If you backed every favourite for $1, you would have lost $631.34 over 47,660 $1 bets placed.
Over 47,951 races, the second favourite wins 19.83% of the time. If you backed every second favourite for $1, you would have lost $721.02 over 47,951 $1 bets placed.
Over 48,135 races, the third favourite wins 13.49% of the time. If you backed every third favourite for $1, you would have lost $491.77 over 48,135 $1 bets placed.
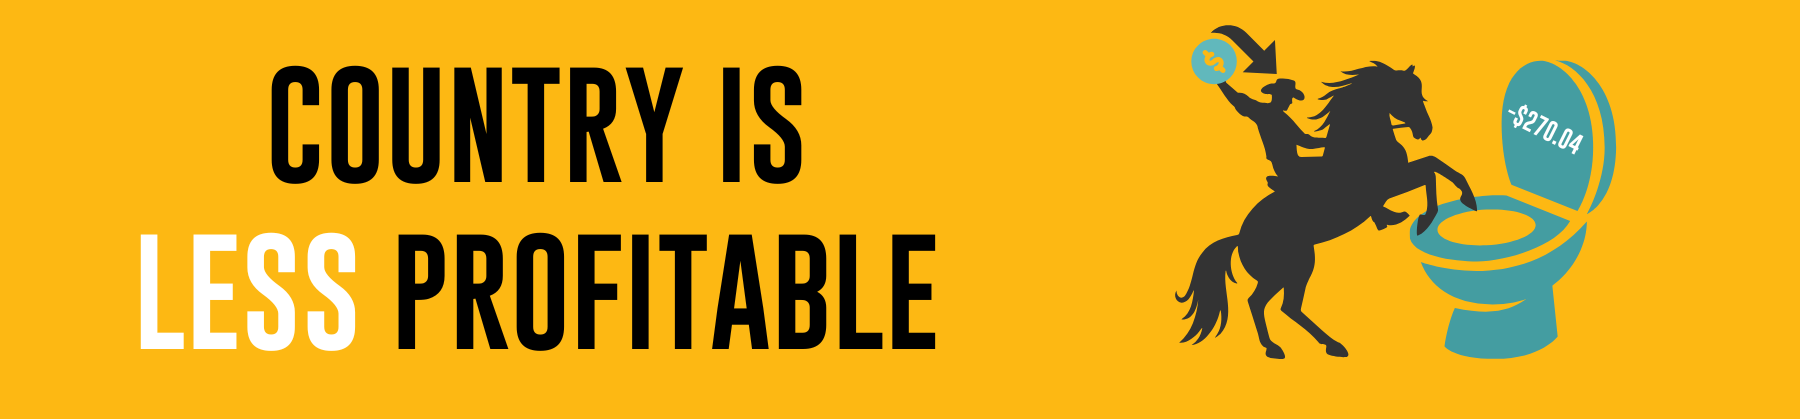
This table compares how often favourites win on country, metro, and provincial tracks.
Clearly, simply backing favourites does not guarantee profit, regardless of track type. Although the win rates are similar, the difference in theoretical profit is significant.

This table shows how often the favourite wins at each track and highlights which track is most profitable.
So, which track is most profitable? Interestingly, Dubbo has the highest profitability for favourites, However, other tracks such as Albury and Kilmore also demonstrate strong returns, emphasising that certain locations may yield better results when backing favourites.

This table shows how often favourites win, broken down by race class.
In Steeplechase races, favourites win over half the time, with a 53.97% win rate and a positive profit of $8. This makes Steeplechase a particularly profitable race class for those backing favourites.
While other classes have a solid win strike, Steeplechase stands out for both its high win rate and positive returns.

This table shows how often the favourite wins over the distance. Note the tracks were grouped to their nearest 100 meters. EG If the race was 1820m, it would be grouped together as an 1800m.
While the 900-meter distance shows the highest profitability, it appears that favourites have a better win strike rate at longer distances.
This insight suggests that, although short sprints can be profitable, favourites may find more consistency in success over extended distances.

We looked at the first letter in every horse’s name and winners across all races, It doesn’t really mean much but it is interesting nonetheless.
If you see a Favourite running at Dubbo in a long distance and its name starts with an “X” – just back it
Interested in more statistics? Check out our AFL Betting Statistics post.
“Insights in this article were created using the Racing Analytics Expert Form Database.”

The Verdict Is In (and It’s Not Sportsbet) – Best…

New Betting Sites in Australia 2026: Fresh Platforms for Smart…

Multi Bets – Complete Guide for AFL, NRL & Racing…

Matched Betting in Australia: The Ultimate Guide Stop guessing. Start…